I’m planning on running some performance tests on my OpenStack Swift deployment running on Seagate Kinetic drive. The Kinetic drives are Ethernet drives ie. the Swift proxy server access the drives using REST like API’s.
While looking for Network monitoring tools running on Linux I came across this very site, that talks about some 18 or so tools to monitor network bandwidth on Linux server.
I evaluated a few of them, and found two that would my requirements. The tools that I short-listed are cbm (Color Bandwidth Meter) and tcptrack.
Here are couple of screen shots from each of the tools.
The tcptrack tool tells me all the connections made from the Clinet(the Swift PACO node) to the Kinetic drives. The first screen-shot was while running the getput benchmarking tool, while the second was using the knobs benchmarker-swift-write.py script


While looking for Network monitoring tools running on Linux I came across this very site, that talks about some 18 or so tools to monitor network bandwidth on Linux server.
I evaluated a few of them, and found two that would my requirements. The tools that I short-listed are cbm (Color Bandwidth Meter) and tcptrack.
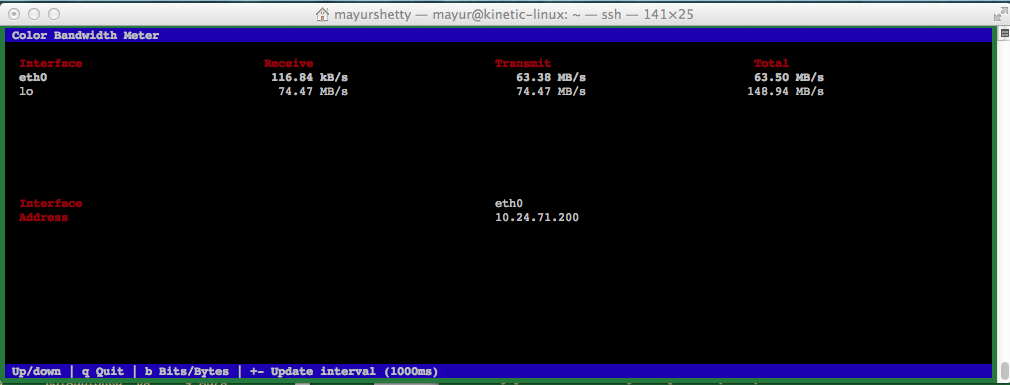
Here are couple of screen shots from each of the tools.
The tcptrack tool tells me all the connections made from the Clinet(the Swift PACO node) to the Kinetic drives. The first screen-shot was while running the getput benchmarking tool, while the second was using the knobs benchmarker-swift-write.py script
The cbm tool tells me Total data transfered from each of the network interfaces on the PACO server. Similar to above, the first screen-shot was while
running the getput benchmarking tool, while the second was using the
knobs benchmarker-swift-write.py script
NOTE: As this was just a dry run for the check the network monitoring tools, I just used a single Kinetic drive to create the Object ring.
3 comments:
Mayur,
In the above screenshot is each server node a Kinetic Drive?
Saqob
Saqib,
Each Kinetic Drive has has two IP addresses. I'm using one of the two IP addresses while creating the Object Ring in Swift.
Note, that this was just a test setup where I used one Kinetic drive (1 IP address) to create the Object Ring.
The X86 node as a storage server no more exists in a Swift deployment with Kinetic drives.
Nice blog... I found this blog very helpful for me to understand OpenStack development. Is OpenStack deployment tools more helpful in OpenStack deployment
Post a Comment